Supercharge your Spark workloads with power of ZettaProf’s analysis and recommendations.
Contact support@zettabolt.com to get started with ZettaProf!
What is ZettaProf?
Apache Spark is a well established tool in Big Data pipelines. There are open source as well as several commercial offerings for Spark. With such widespread usage, Spark is also often misused. Valuable customer dollars and resources are wasted due to poorly configured Spark clusters. Current profiling solutions for Spark lack :
Full insights into resource wastage and scope for optimization
Wide availability
Completeness
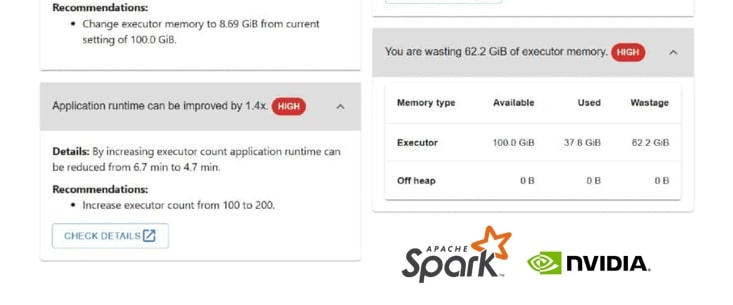
ZettaProf was built to address users’ requirements for building optimized Spark solutions. Over a period of time, it has evolved into a mature product which can be used by novice and expert Spark developers alike. Based on the insights offered by ZettaProf, we have been able to provide 10-100x performance improvements to our partner customers. Key capabilities which differentiate ZettaProf over other solutions:
Works with any Spark distribution : Open Source, Databricks, Azure Synapse, AWS EMR, nVidia RAPIDs (on cloud or on-prem)
Most comprehensive profiler with rich set of features and recommendations
Zero touch deployment with no change to existing Spark code or queries
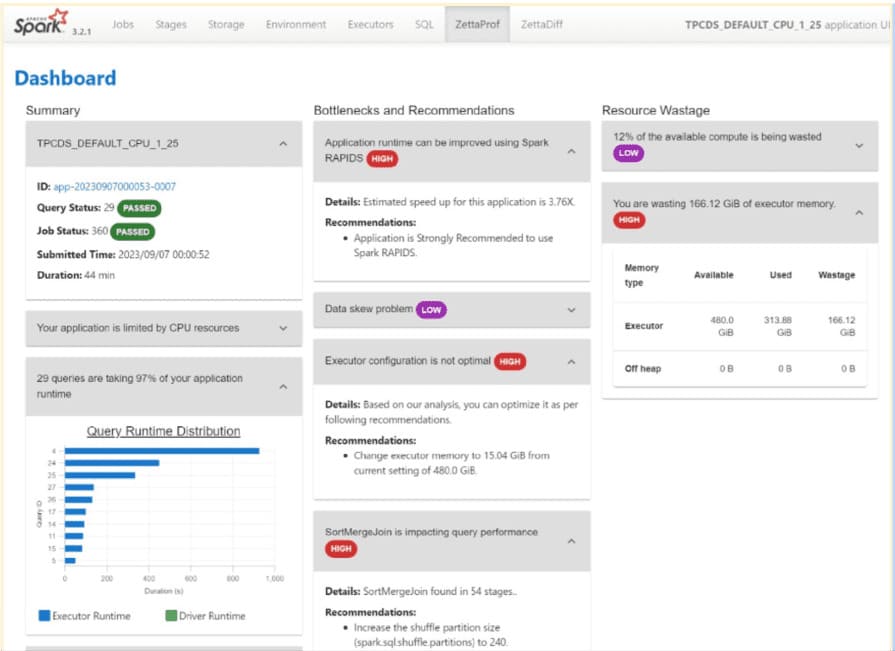
ZettaProf Dashboard provides a bird’s eye view of Spark application by giving a summary of performance, report on resource utilization and recommendations for improvement. Users can deep-dive into fine-grained details to further look at various aspects (CPU, RAM, disk writes/reads, stage/operator runtimes etc.) of the full application as well as individual queries.
ZettaProf sits alongside the Spark UI and a click on “ZettaProf” tab will take the user to a dashboard as in the picture below:
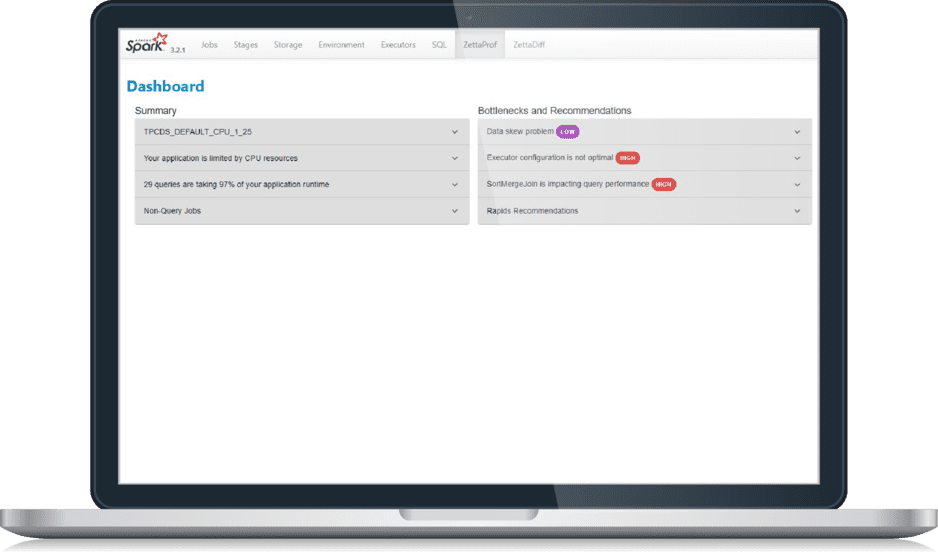
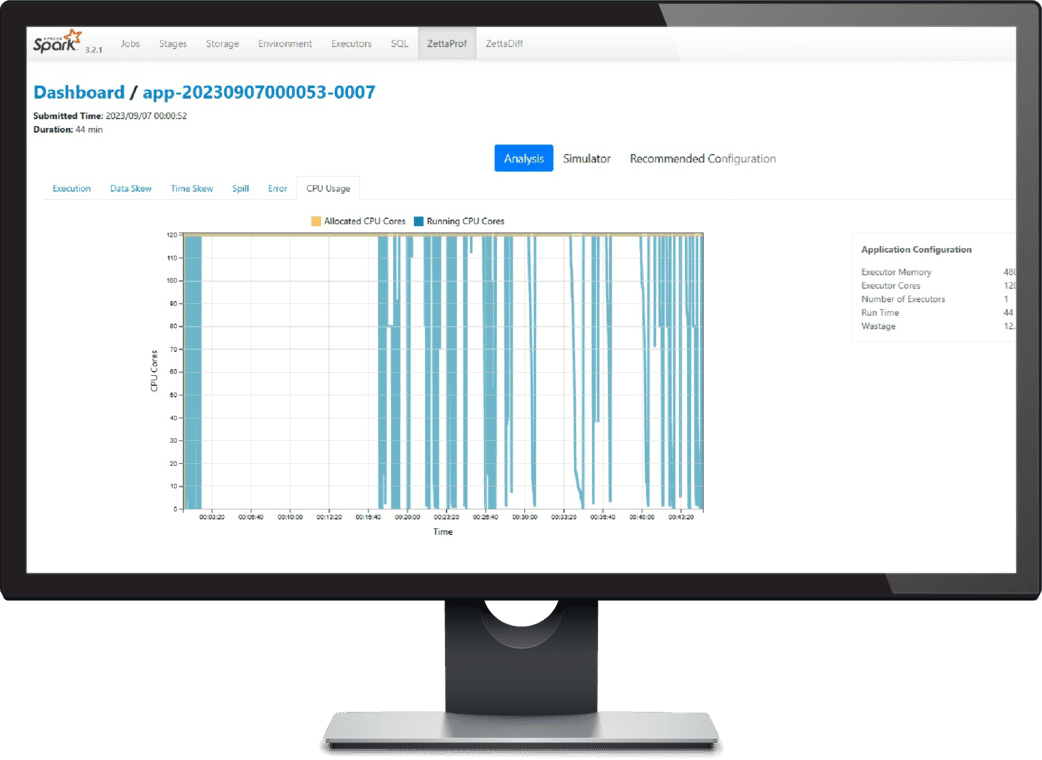
Tabs can be further expanded to get additional information about the flagged issues as in the picture below:
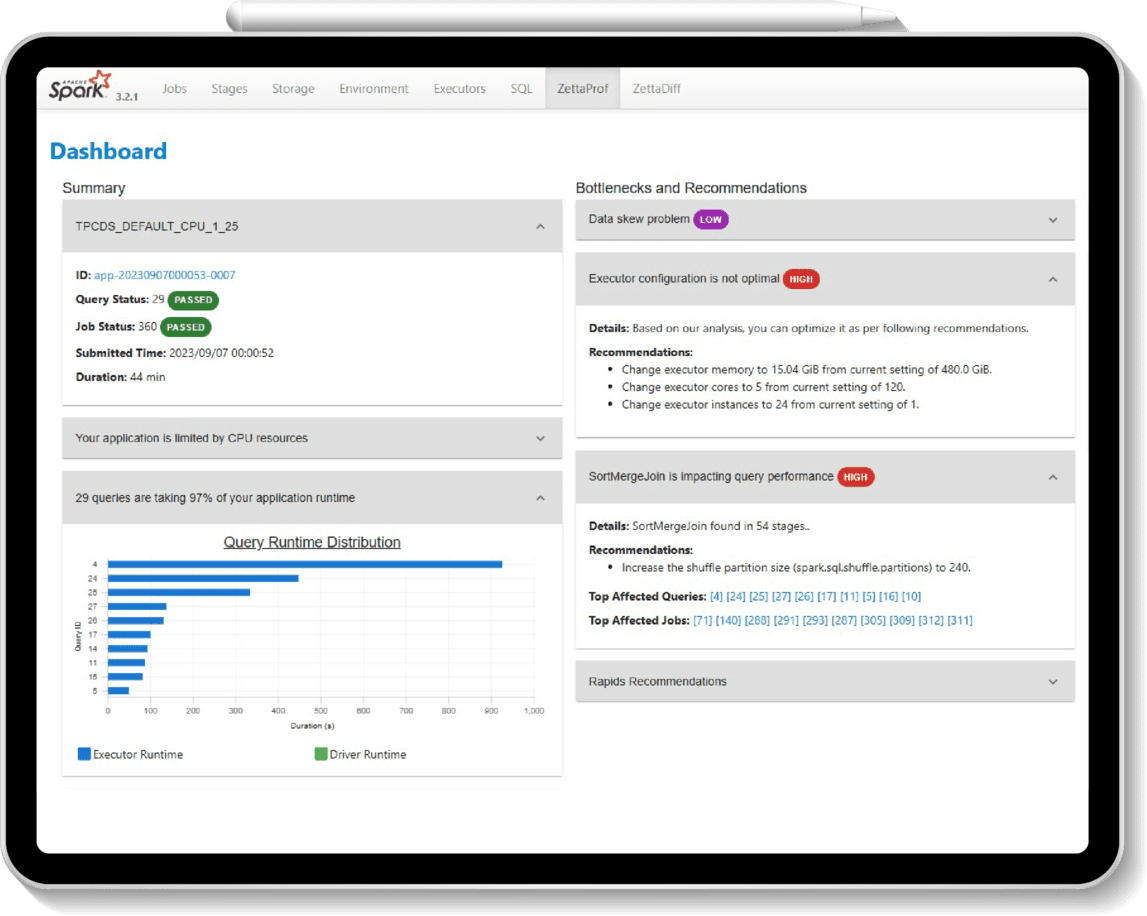
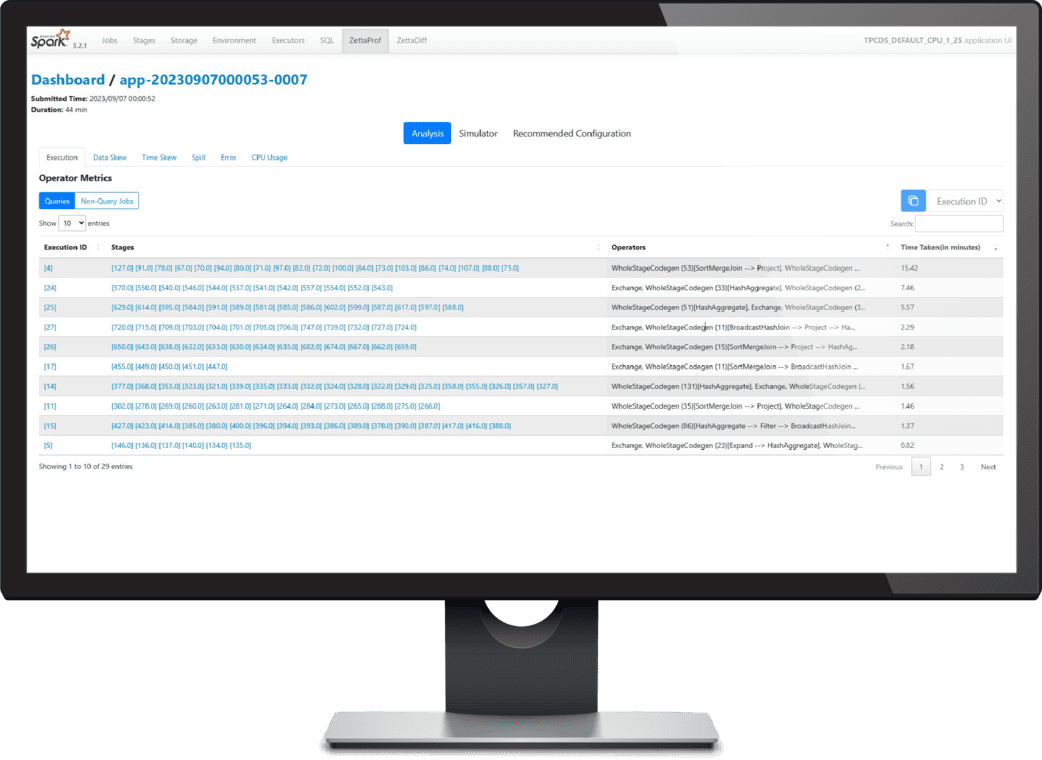
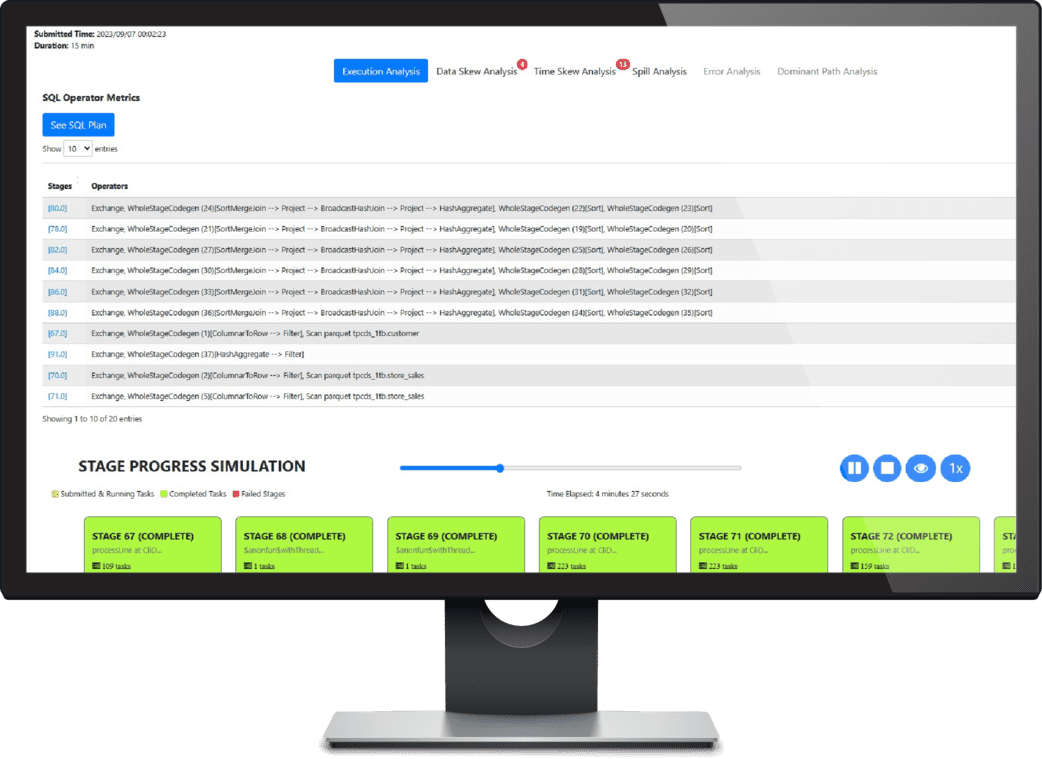
From the Dashboard, user can deep-dive into specific issues by clicking on the hyperlink and also start the Application or Query level analysis. Use of resources, common Spark setup issues and skew/spill problems are displayed through charts and tables. User can perform trade-off analysis (more cores versus runtime impact), run query replay to identify slow stages or identify critical paths acting as bottlenecks for time consuming queries.
EFFICIENCY OF
ALLOCATED RESOURCES:
Topmost care about for any Spark application is to understand if the allocated resources are being used efficiently. ZettaProf’s Efficiency Analysis feature helps a user explore following:
-
CPU and RAM usage across complete application timeline
Top runtime consuming queries
Simulating impact of CPU allocation (increase/decrease executors) on application performance
Recommended settings for Executors, Cores, Memory to achieve best performance
APPLICATION
LEVEL ANALYSIS
Exploration of Application performance is provided by following features:
-
List of queries, stages and operations sortable by runtime
Queries impacted by Data and Time skew (imbalance)
Amount of disk reads/writes happening per query
Error reports and analysis
Executor and Driver efficiency
QUERY
LEVEL ANALYSIS
Exploration of Query performance is provided by following features:
List of stages and operations sortable by runtime
Details of Data & time skew at the task level
Details of disk read/writes
Errors specific to the query
Critical path analysis
Slowest path in the query plan
Fastest possible query runtime
| Feature | ZettaProf | Unravel | Pepper Data | Qubole | Databricks | Azure Synapse |
|---|---|---|---|---|---|---|
| Integration with Spark UI | ✅ | ❌ | ❌ | ❌ | ✅ | ✅ |
| Available on cloud and on-prem | ✅ | ✅ | ✅ | ✅ | ✅ | Azure only |
| Support for all Spark distros | ✅ | Partial | Partial | Partial | Partial | Azure only |
| Dashboard | ✅ | ✅ | ✅ | ❌ | ❌ | ❌ |
| Resource problems: CPU, memory, disk, network etc. | ✅ | ✅ | ✅ | ✅ | ✅ | ✅ |
| Spark configuration issues | ✅ | ✅ | ✅ | ❌ | ✅ | ✅ |
| Runtime problems: Lack of parallelism, bad join, spill, skew, errors, OOMs etc. | ✅ | ✅ | ✅ | ✅ | ✅ | ✅ |
| Recommendations to fix issues | ✅ | ✅ | ❌ | Partial | ❌ | ✅ |
| Application comparison | ✅ | ❌ | ✅ | ❌ | ❌ | ✅ |
| Query comparison | ✅ | ❌ | ✅ | ❌ | ❌ | ❌ |
| Query runtime simulation | ✅ | ❌ | ❌ | ❌ | ❌ | ✅ |
| Slowest/fastest path analysis | ✅ | ❌ | ❌ | ✅ | ✅ | ❌ |
| Runtime simulation with change in cores | ✅ | ❌ | ❌ | ✅ | ❌ | ❌ |
| Operator level runtime analysis | ✅ | ❌ | ❌ | ❌ | ✅ | ✅ |
| Alerts | ❌ | ✅ | ✅ | ❌ | ❌ | ❌ |
ZettaProf is currently available under Limited Engagement Plan. If you would like to try ZettaProf, please contact support@zettabolt.com for a trial version.
Zettabolt Technologies (http://www.zettabolt.com) is focused on building profiling and optimization solutions for Big Data workloads. Large hardware vendors, finance institutions and e-Commerce companies use our solutions to achieve cost savings and performance improvements above and beyond what state-of-the-art technology can provide. With expertise in CPU, GPU and FPGA based optimizations, solutions have been built which can realize up to 100x speed-ups on a variety of customer workloads.
Ready to unlock the full potential of your enterprise knowledge?
OUR BLOGS & WHITEPAPERS