Accelerating Debugging with Advanced Visualization Using LPC
Introduction
For a small engineering team racing against tight deadlines, debugging wasn’t just a task — it was a bottleneck.
Their existing low-power verification tools gave only limited insight into the design, leaving engineers to piece together clues from incomplete reports.
Finding the root cause of violations — especially complex issues like missing isolation cells in multi-voltage designs — felt like searching for a needle in a haystack, blindfolded.
Challenge
Difficult to pinpoint root cause of violations
- With a small engineering team and aggressive timelines, the customer needed a low-power verification solution with powerful and intuitive debugging capabilities.
- Their existing tools provided limited visibility into the design, making it difficult to pinpoint the root cause of violations, especially for complex issues like missing isolation cells in multi-voltage designs.
Zettabolt Solution
LPC’s powerful GUI
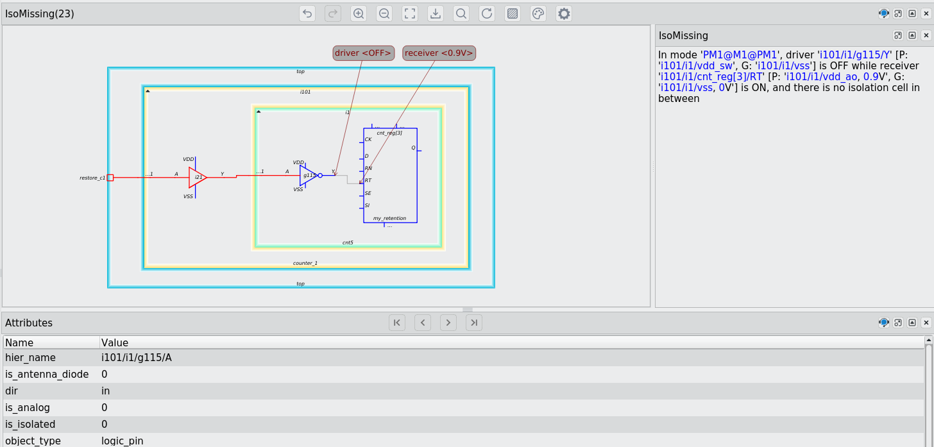
- The LPC tool's powerful GUI and debugging features were a game-changer for the customer. The ability to visualize clear boundaries for power domains and use the Incremental Schematic Viewer to see the exact location of a violation, complete with driver and receiver information, drastically reduced their debugging time.
Results
- The cross-referencing capabilities, allowing them to jump from a violation report directly to the relevant section of the design, library, or UPF file, empowered their engineers to find and fix problems with unprecedented speed and accuracy.

Let's Talk